Analyzing the Role of Vegetation in Urban Heat Islands
This project investigates how vegetation influences temperature in urban heat islands. By comparing areas with varying plant cover, students can assess the cooling effects of vegetation.
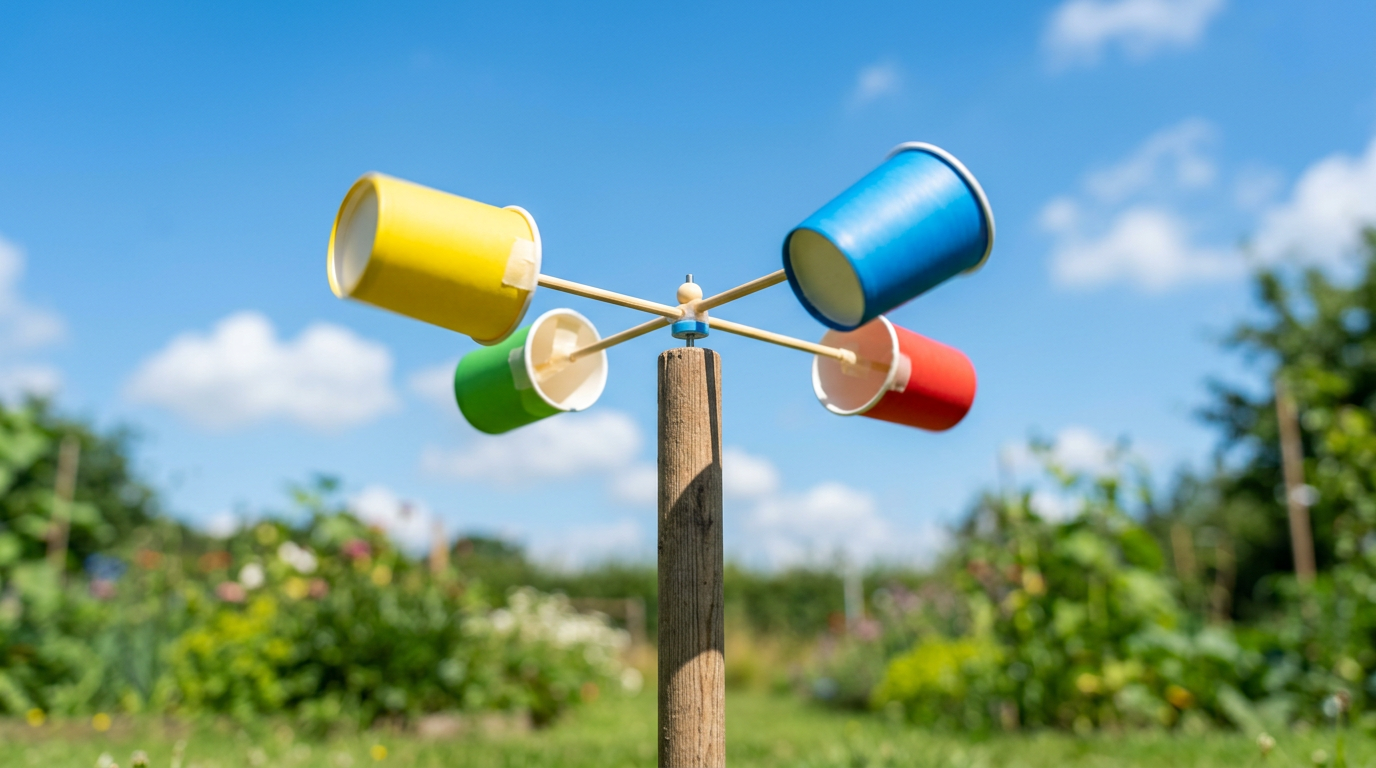
In this project, students will construct a simple anemometer to measure wind speed. They will learn about wind energy and its potential to power communities, while collecting and analyzing wind speed data over several days.

If the anemometer spins faster, then the wind speed is greater than on slower spinning days.
As an Amazon Associate, this site earns from qualifying purchases.
Mark one of the paper cups with a different color for visibility.
Punch four evenly spaced holes near the rim of this cup.
Insert two straws to form a cross, using the holes as guides.
Attach one cup to each end of the straws, ensuring they all face the same direction.
Use a pushpin to attach the center of the straws to the eraser end of the pencil.
Ensure the anemometer can spin freely by holding the pencil upright.
Place the anemometer in a windy location.
Count the number of rotations in a set time period and record the data over several days.
The anemometer will rotate faster in stronger winds, providing a simple method to measure wind speed. This highlights the variability of wind in producing energy.
Wind speed
Rotations per minute
Design of the anemometer, Counting period, Location for testing
Be careful with sharp objects like scissors and pushpins. Ensure the structure is secure before testing outdoors.
Showcase the anemometer's design and explain its function.
Provide a table or graph of collected data.
Discuss wind power's benefits and potential for sustainable energy.
An anemometer is an instrument used to measure wind speed.
It can measure relative wind speeds, but might not withstand very strong winds.
To easily count the number of rotations during a set time period.