
Analyzing the Role of Vegetation in Urban Heat Islands
This project investigates how vegetation influences temperature in urban heat islands. By comparing areas with varying plant cover, students can assess the cooling effects of vegetation.
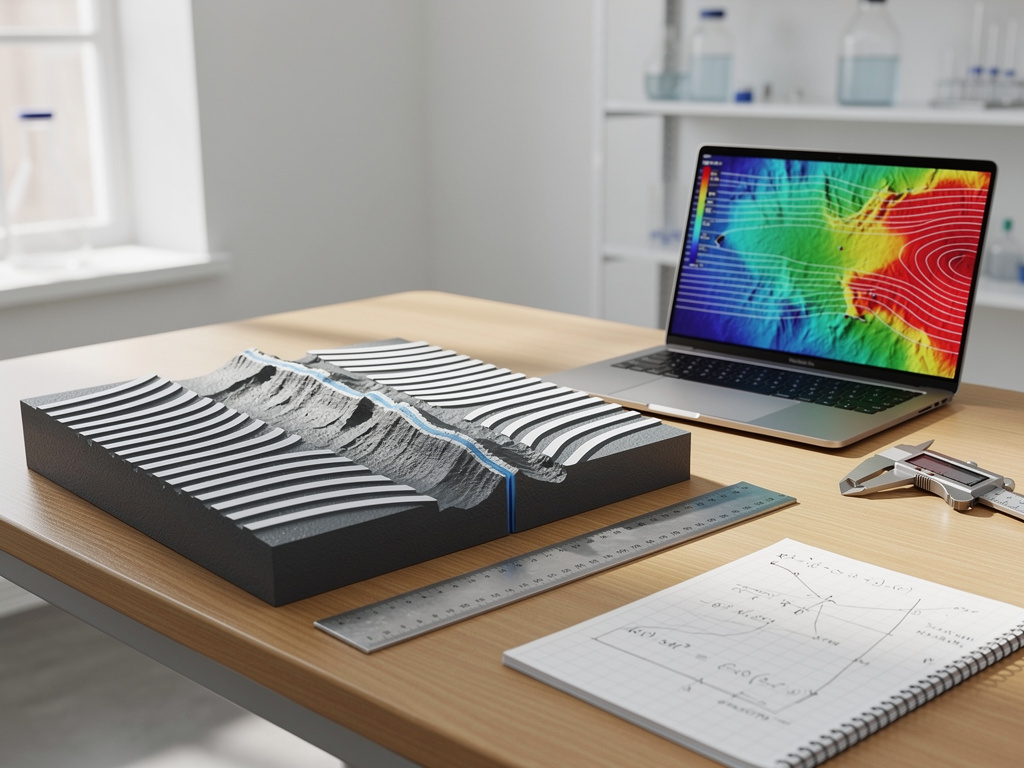
Utilize published magnetic stripe data to calculate seafloor spreading rates. This project demonstrates the movement of tectonic plates over time.

If magnetic stripe data is analyzed, then seafloor spreading rates can be accurately calculated.
As an Amazon Associate, this site earns from qualifying purchases.
Access magnetic anomaly data for a specific oceanic ridge.
Plot the data on graph paper to visualize magnetic stripes.
Measure the distance between stripes to determine spreading rates.
Calculate the rate using the age of the stripes.
Repeat the process for different ridge segments.
Compare calculated rates with published data.
Analyze how spreading rates vary along the ridge.
Document findings with graphs and calculations.
The calculated spreading rates should align with published data, confirming the movement of tectonic plates over geological time.
Location on the ridge
Seafloor spreading rate
Data source, Calculation method, Measurement tools
Ensure the accuracy of data and calculations for reliable results.
Include detailed graphs of magnetic anomalies.
Explain the significance of magnetic stripes.
Discuss the implications for understanding plate tectonics.
They are caused by variations in Earth's magnetic field recorded in oceanic crust.
They show symmetrical patterns on either side of ridges, indicating seafloor spreading.
It helps explain the movement of tectonic plates and the formation of ocean basins.