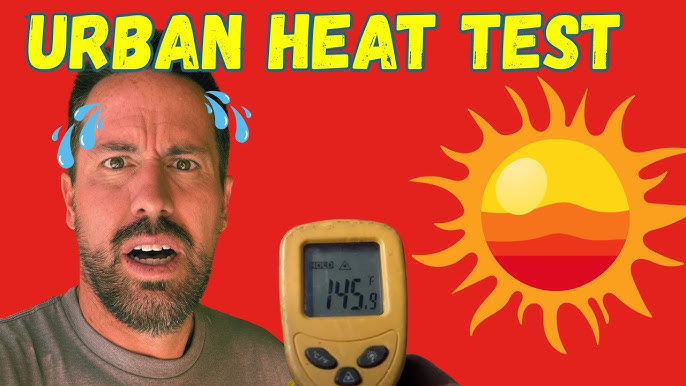
Analyzing the Role of Vegetation in Urban Heat Islands
This project investigates how vegetation influences temperature in urban heat islands. By comparing areas with varying plant cover, students can assess the cooling effects of vegetation.
This project involves observing and recording sunspot activity over several weeks. By tracking sunspots, students learn about solar activity and its cyclical nature.

If sunspots are observed over time, then they will show changes in number and position due to solar rotation and activity cycles.
As an Amazon Associate, this site earns from qualifying purchases.
Set up a telescope with a solar filter to safely observe the sun.
Project the sun's image onto a piece of white paper using the telescope.
Identify and sketch the sunspots visible on the paper.
Record the date and time of each observation.
Repeat observations every few days for several weeks.
Note changes in the number and position of sunspots in your notebook.
Analyze the data to identify patterns in sunspot activity.
Compare your findings with historical sunspot data.
Sunspots will appear to move and change in number over time due to the sun's rotation and varying solar activity.
Time
Number and position of sunspots
Observation method, Telescope setup, Time of day
Never look directly at the sun without proper solar filters to prevent eye damage.
Use a chart to show sunspot changes over time.
Include sketches of sunspots from different days.
Explain the significance of sunspots in understanding solar activity.
Discuss how sunspots affect Earth.
Sunspots are cooler, darker areas on the sun's surface caused by magnetic activity.
Sunspots change due to the sun's rotation and variations in magnetic activity.
Observing every few days is sufficient to notice changes in sunspot activity.