Analyzing the Role of Vegetation in Urban Heat Islands
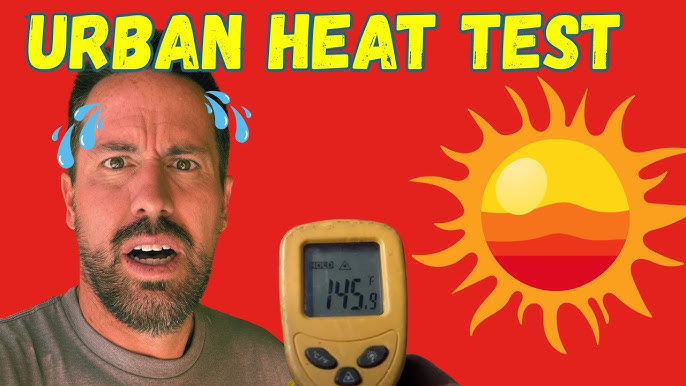
This project investigates how vegetation influences temperature in urban heat islands. By comparing areas with varying plant cover, students can assess the cooling effects of vegetation.
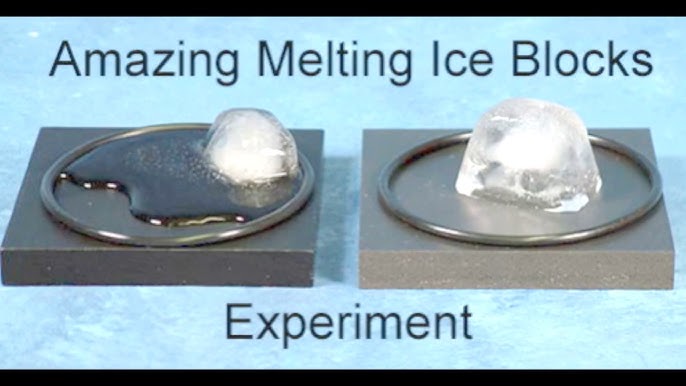
This project examines the effect of ice shape on melting rates. By comparing different ice shapes (cubes, spheres, and shards), students will learn about surface area, temperature, and melting processes, enhancing their understanding of physical science.

Ice in shapes with larger surface areas will melt faster than those with smaller surface areas.
As an Amazon Associate, this site earns from qualifying purchases.
Make ice cubes in the tray, spheres in the mold, and prepare crushed ice.
Place each shape of ice in separate containers at room temperature.
Start the timer as soon as you place the ice.
Observe and record the melting time of each shape.
Check every 5 minutes and note how much ice remains.
Repeat the experiment multiple times for accuracy.
Calculate the average melting time for each shape.
Analyze the data to see how shape affected melting speed.
Prepare a report of your findings.
Create a visual presentation with charts.
Practice explaining the results and their implications.
Engage the audience with questions.
It is expected that the ice shapes with greater surface areas, like shards, will melt faster than solid cubes or spheres.
Shape of the ice
Melting time
Temperature of the environment, Amount of ice, Container type
Handle ice carefully to avoid spills, and ensure the area is safe for observing melting.
Use visuals to show different ice shapes.
Create graphs to present melting times.
Explain the science of melting and surface area.
Engage the audience with a live demo if feasible.
Prepare for a Q&A session.
Use cubes, spheres, and crushed ice for variety.
Use the same environmental conditions for each trial.
You can conduct the experiment in a cooler environment to slow down melting.