
Analyzing the Role of Vegetation in Urban Heat Islands
This project investigates how vegetation influences temperature in urban heat islands. By comparing areas with varying plant cover, students can assess the cooling effects of vegetation.
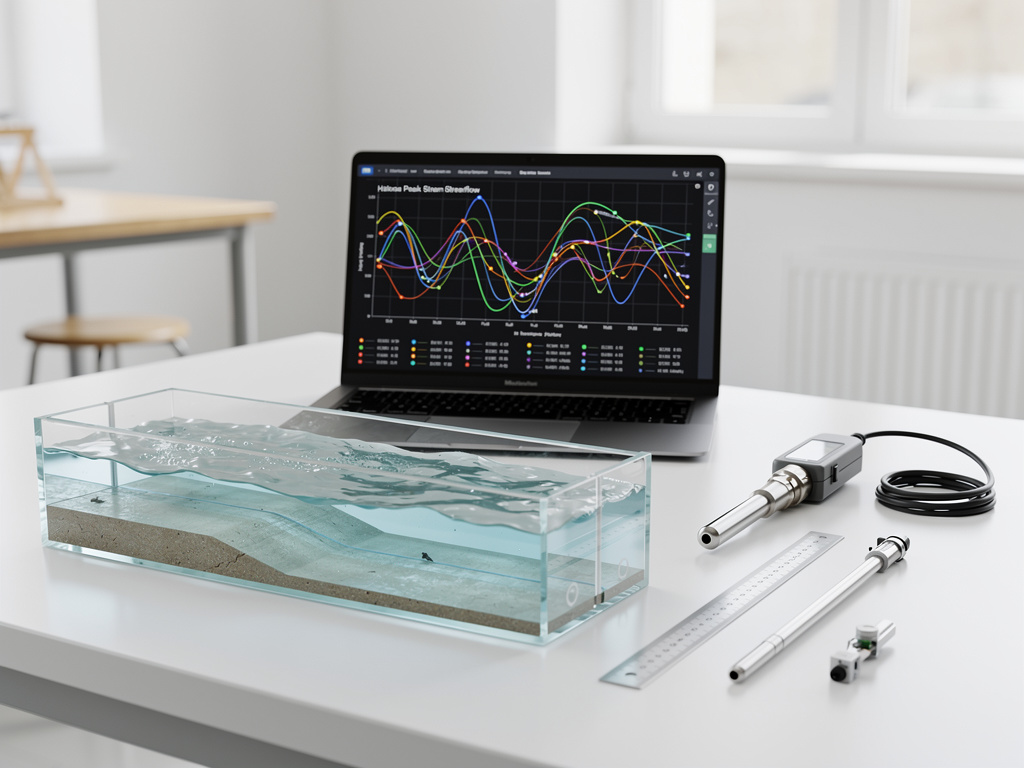
This project involves analyzing historical peak streamflow data to estimate the recurrence intervals of floods. It helps in understanding flood risks.

If historical peak streamflow data is analyzed, then accurate flood recurrence intervals can be estimated.
As an Amazon Associate, this site earns from qualifying purchases.
Collect historical streamflow data from a reliable source.
Organize the data in a spreadsheet.
Rank the peak streamflow events from highest to lowest.
Calculate the recurrence interval using the formula: RI = (N+1)/M, where N is the number of years of record and M is the rank.
Plot recurrence intervals against the peak streamflow.
Analyze the data to identify trends and patterns.
Compare the calculated intervals with any existing flood predictions.
Document your findings in a report.
You should be able to estimate the recurrence interval for different levels of flooding. This will help assess flood risks in the studied region.
Year of data
Recurrence interval
Location of stream gauge, Data source, Calculation method
Ensure data accuracy to avoid incorrect predictions.
Use graphs to display recurrence intervals.
Include a map showing the location of stream gauges.
Discuss the implications of your findings for flood management.
It's an estimate of how often a flood of a certain size is likely to occur.
Historical data provides trends that help predict future flood events.
Accuracy depends on the quality and length of historical data used.