Science Fair Projects
physicsmedium middle 15 days

Sound Wave Symphony: Visualizing Sound Frequencies

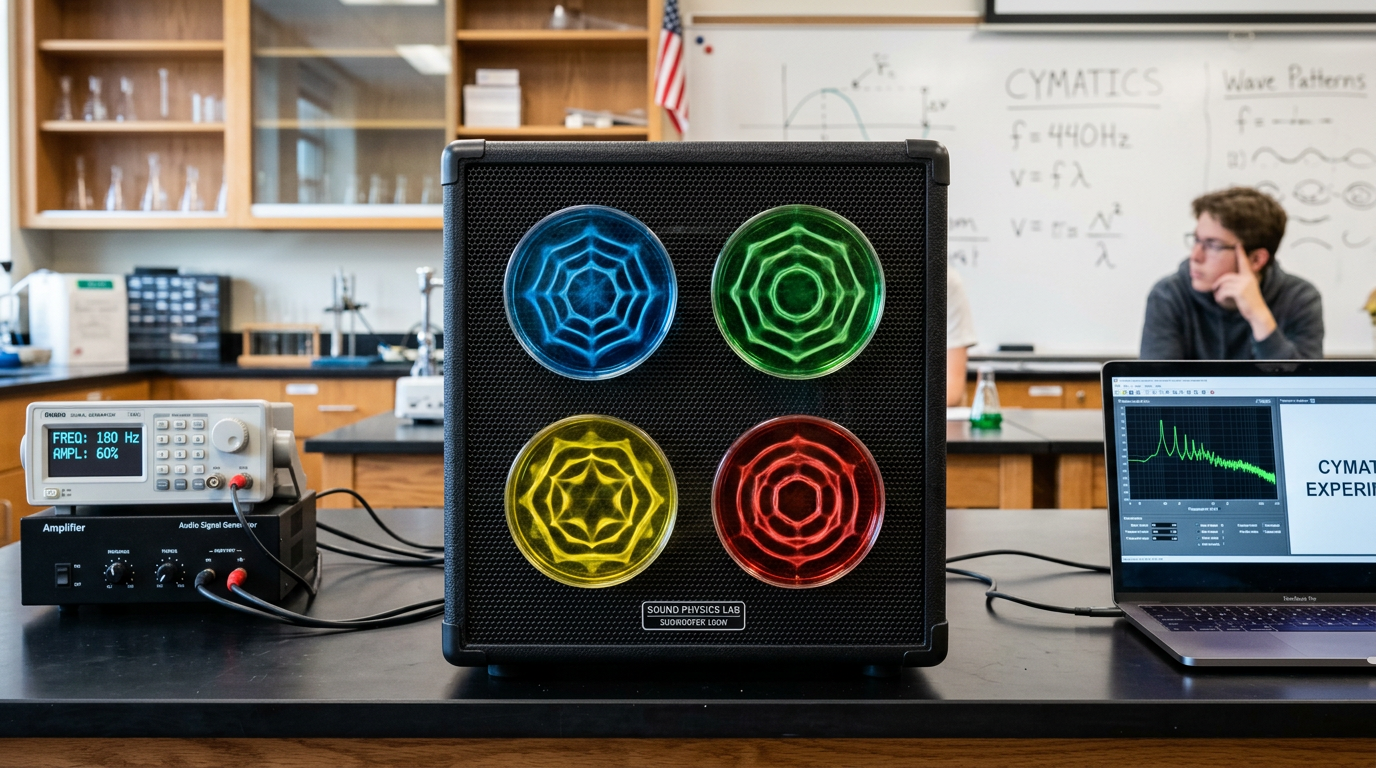
This project helps students visualize sound frequencies by creating a simple setup with a speaker, salt, and a rubber sheet. Observing patterns formed by sound waves enables students to understand sound frequencies better.

Sound Wave Symphony: Visualizing Sound Frequencies

Hypothesis

If a higher frequency sound is played, then more complex patterns will form on the vibrating surface.

Materials Needed

Speaker — 1Buy
Rubber sheet — 1Buy
Salt — 1Buy
Tone generator app — 1Buy
Plastic cup — 1Buy
Tape — 1Buy
Notebook — 1Buy
Ruler — 1Buy
Camera — 1Buy

As an Amazon Associate, this site earns from qualifying purchases.

Step-by-Step Procedure

  1. 1

    Stretch the rubber sheet over the cup, securing it with tape.

  2. 2

    Place some salt evenly over the rubber surface.

  3. 3

    Connect the speaker to a device with a tone generator app.

  4. 4

    Position the rubber-covered cup on top of the speaker.

  5. 5

    Generate a low-frequency tone and observe the salt patterns.

  6. 6

    Record observations and patterns in the notebook.

  7. 7

    Increase the frequency and observe changes in the patterns.

  8. 8

    Document each frequency's pattern with the camera.

  9. 9

    Repeat for a range of frequencies, noting each pattern change.

  10. 10

    Analyze how frequency affects pattern complexity.

  11. 11

    Graph the results to show frequency versus pattern complexity.

  12. 12

    Conclude based on the observed pattern changes.

Expected Results

Higher frequency sounds should create more intricate patterns on the rubber surface, illustrating the impact of frequency on vibration patterns.

Variables

Independent Variable

Sound frequency

Dependent Variable

Pattern complexity

Controlled Variables

Salt amount, Rubber sheet tension, Cup size

Safety Notes

Ensure the volume is not too high to prevent damage to hearing.

Presentation Tips

  • Create a slideshow with pattern images for visual impact.

  • Demonstrate using the tone generator during presentation.

  • Discuss practical applications of sound frequency visualization.

Frequently Asked Questions

What frequencies should be tested?

Use a range of frequencies from low to high to see varied patterns.

Why use a rubber sheet?

The rubber sheet vibrates visibly, allowing patterns to form with salt.

How does this relate to real-world sound wave applications?

This demonstrates how sound waves can be visualized and analyzed in acoustics.

Related Projects

Acoustic Resonance Experiment: Standing Waves in Tubes Science Fair Project
physicsmedium

Acoustic Resonance Experiment: Standing Waves in Tubes Science Fair Project

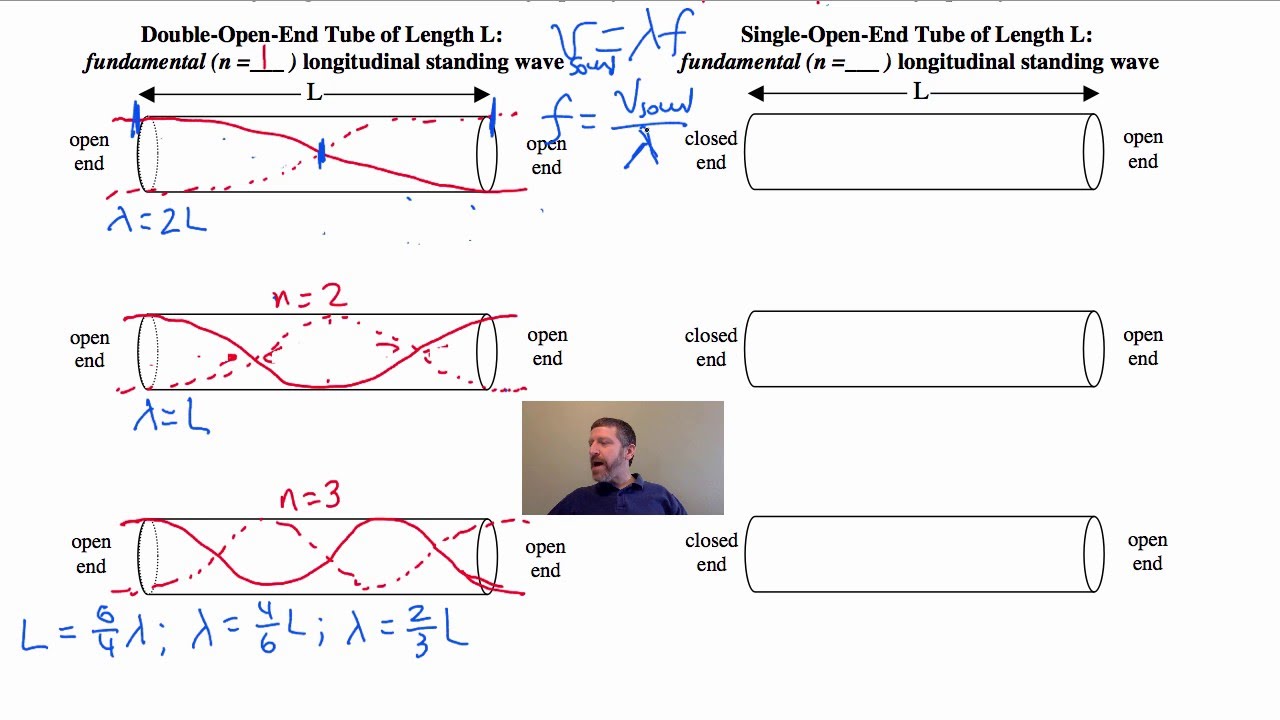
This experiment allows you to explore sound waves and resonance using tubes. By creating standing waves, you'll visualize how sound behaves in different environments. Perfect for middle school science fairs!

7 days·middle
Analyzing Quantum Tunneling in Semiconductor Devices
physicshard

Analyzing Quantum Tunneling in Semiconductor Devices

This project investigates quantum tunneling phenomena within semiconductor devices. Students will measure how electrons traverse energy barriers and analyze how this impacts device efficiency.

25 days·high
Archimedes' Principle: Testing Buoyancy with Different Objects
physicsmedium

Archimedes' Principle: Testing Buoyancy with Different Objects

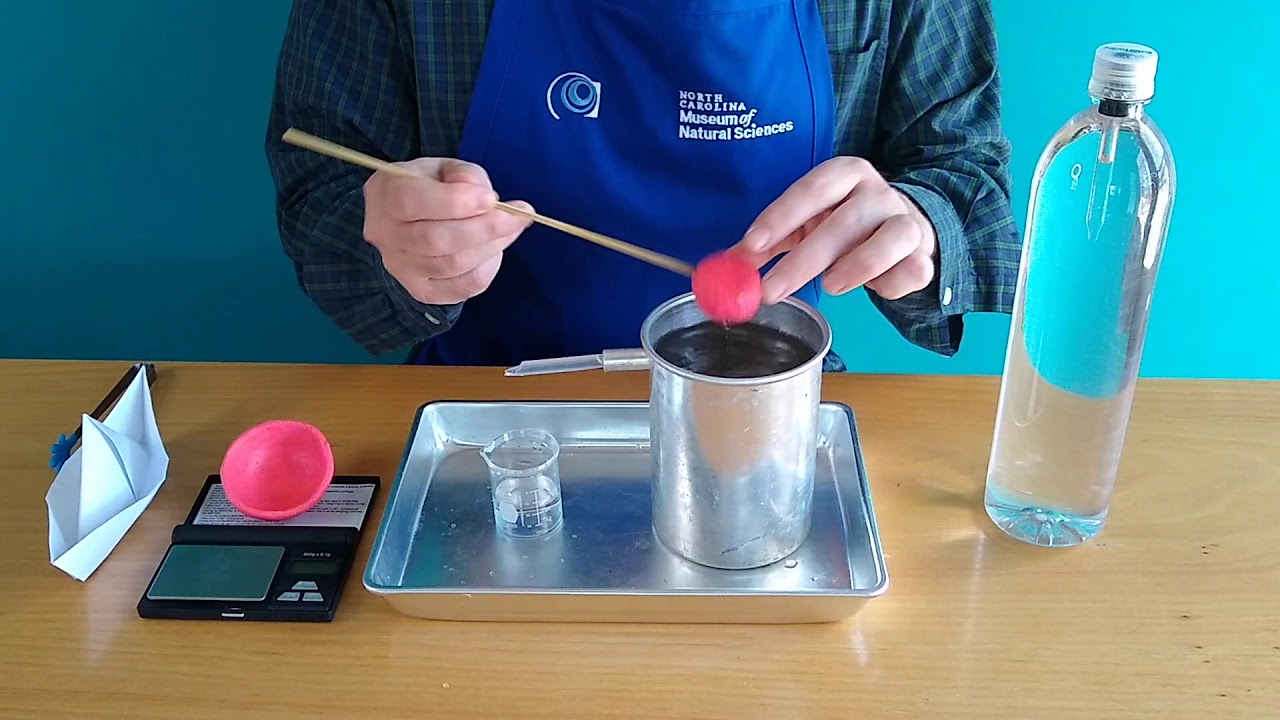
This project allows students to test various objects for buoyancy, demonstrating Archimedes' principle. It engages students in hands-on learning about density and displacement.

7 days·middle
Astronomical Observation - Tracking Planetary Motion
physicsmedium

Astronomical Observation - Tracking Planetary Motion

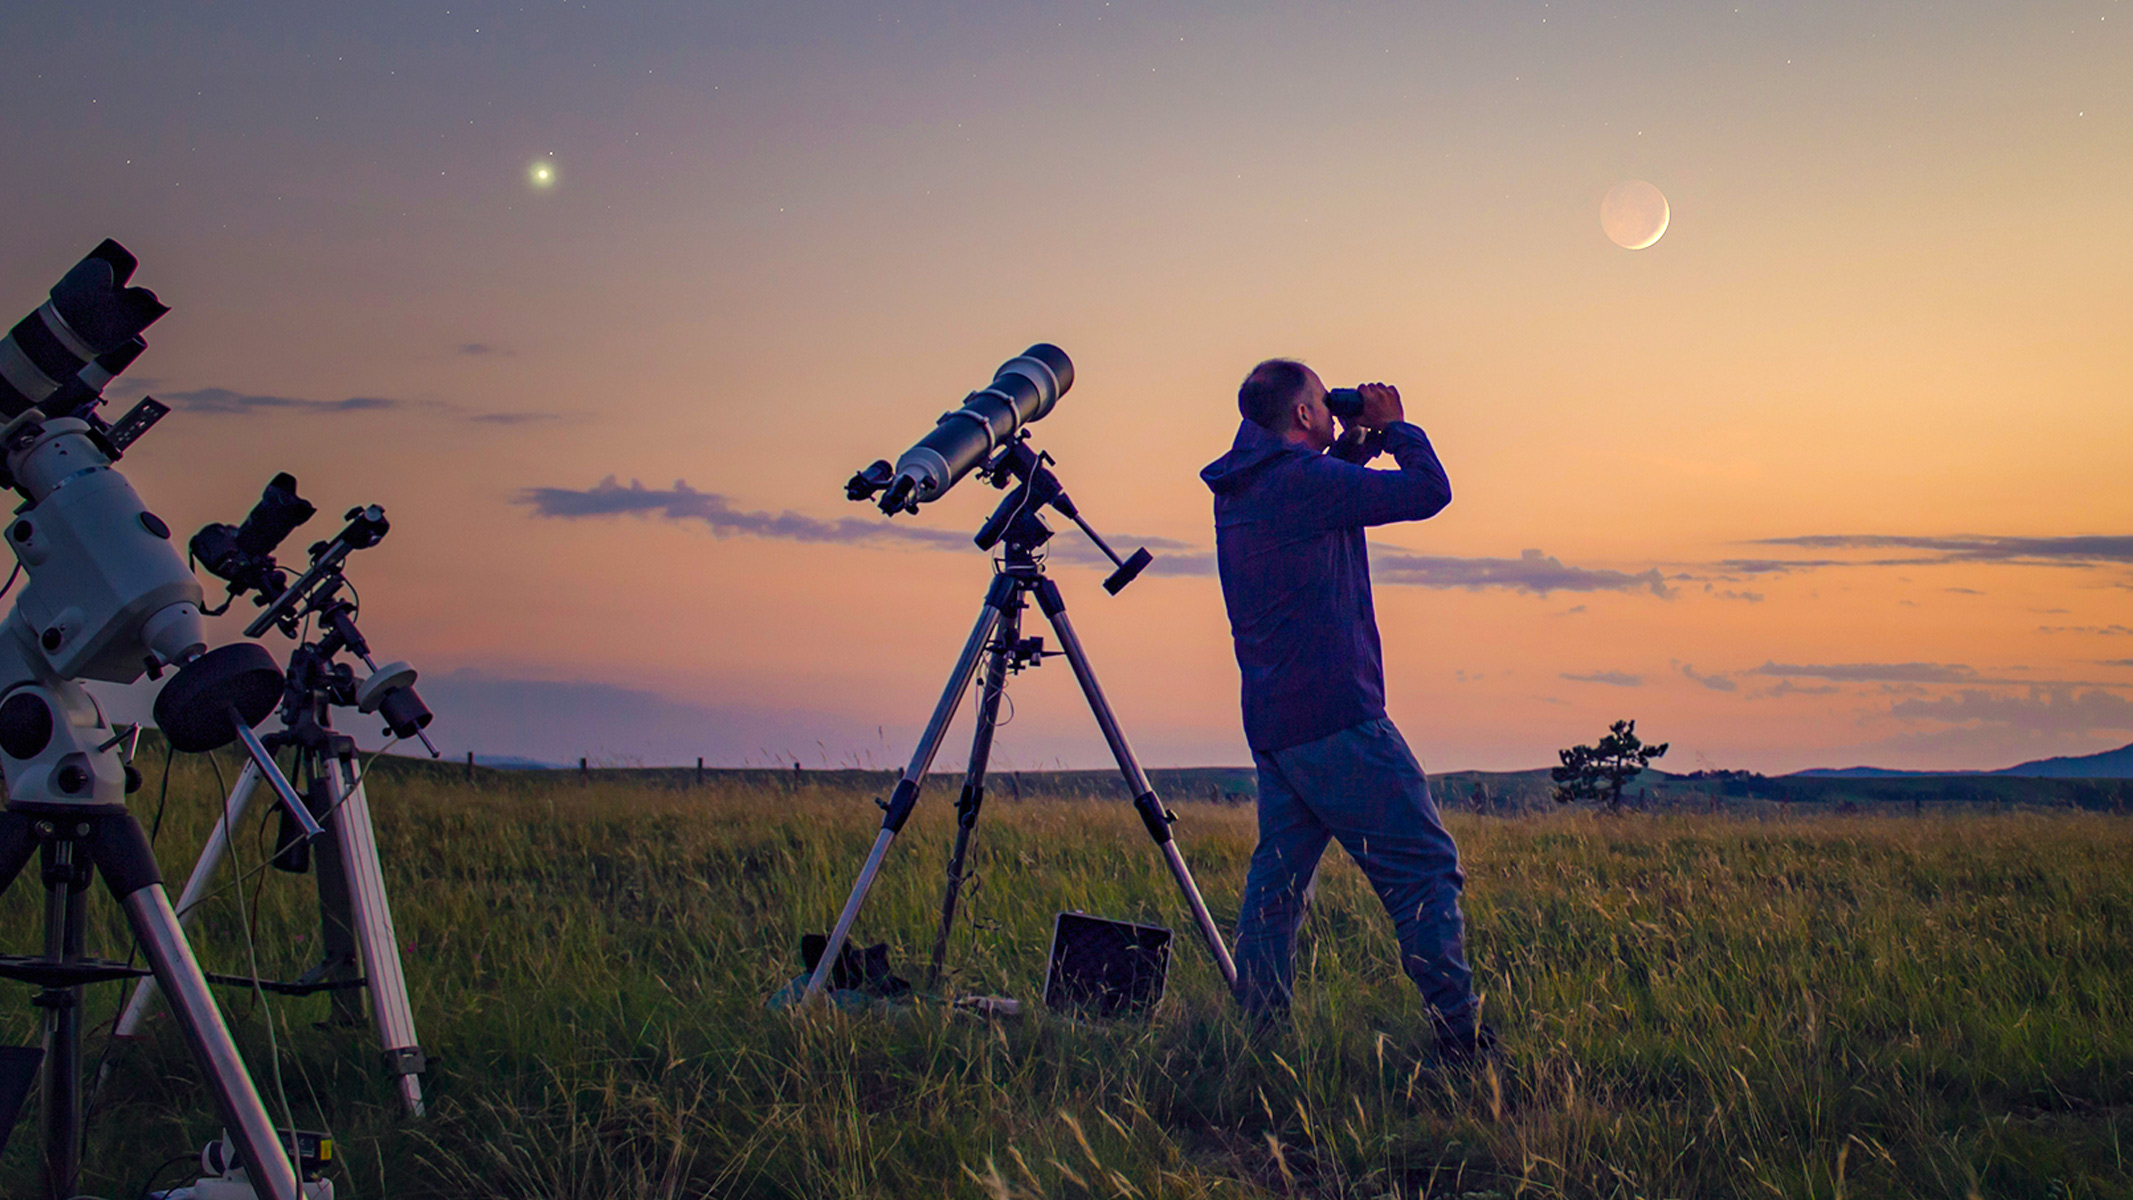
In this project, you will observe and record the positions of planets in the night sky over a month. By using a telescope or binoculars, you will track their movements, document their position on specific dates, and analyze their orbits to understand celestial mechanics. This project fosters an appreciation of astronomy and the dynamics of our solar system.

14 days·high
Atmospheric Pressure and Weather Patterns Analysis
physicsmedium

Atmospheric Pressure and Weather Patterns Analysis

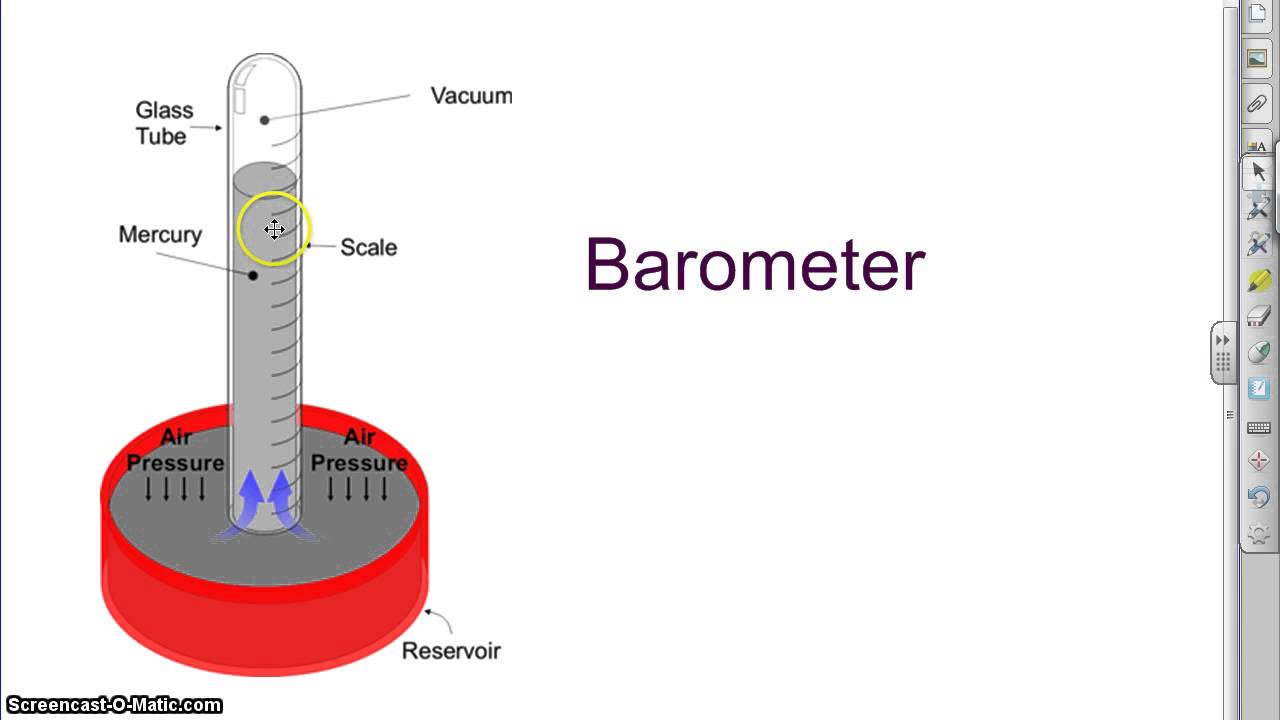
This project investigates how changes in atmospheric pressure correlate with weather conditions. By using a barometer to measure pressure and recording local weather patterns over a week, you will analyze the data to determine relationships and predict weather changes. This project emphasizes the importance of atmospheric science in understanding our climate.

7 days·middle
Balloon Rocket Experiment: Explore Newton's Third Law in Action
physicseasy

Balloon Rocket Experiment: Explore Newton's Third Law in Action

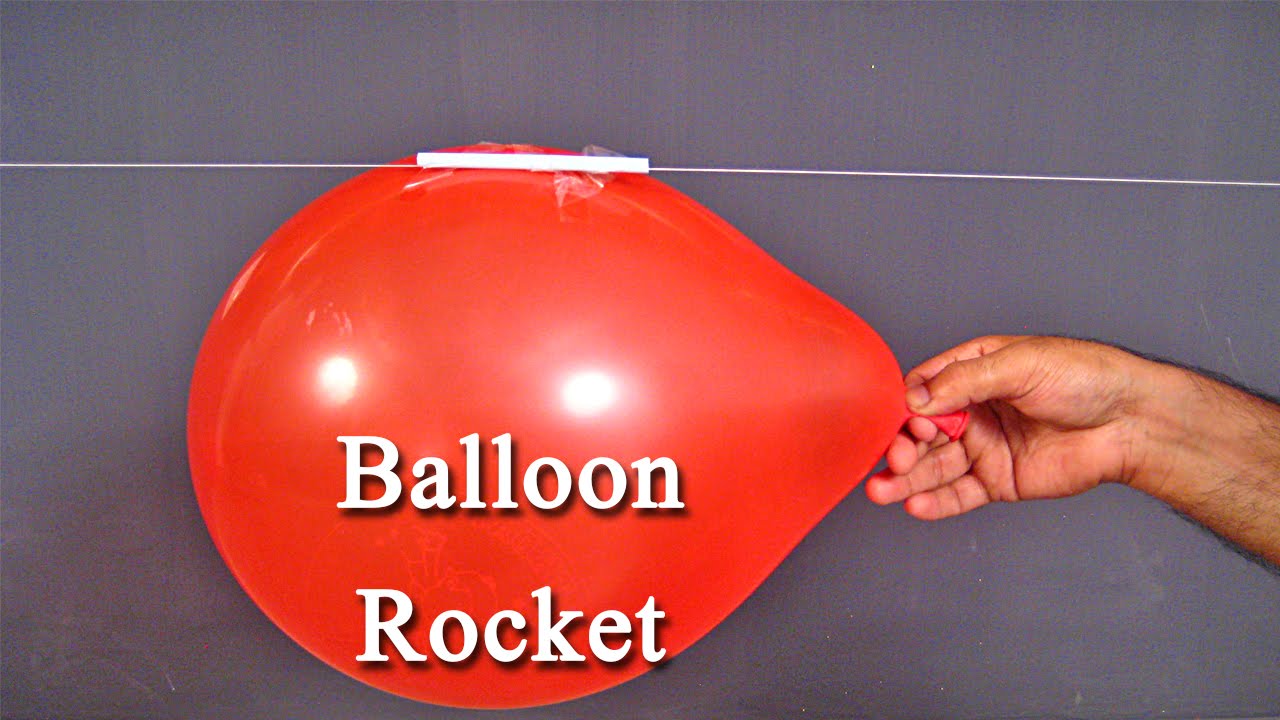
This exciting balloon rocket experiment demonstrates Newton's third law of motion. By launching balloons, students can visually see how every action creates an equal and opposite reaction!

1 days·middle

Like this project? Get more ideas!