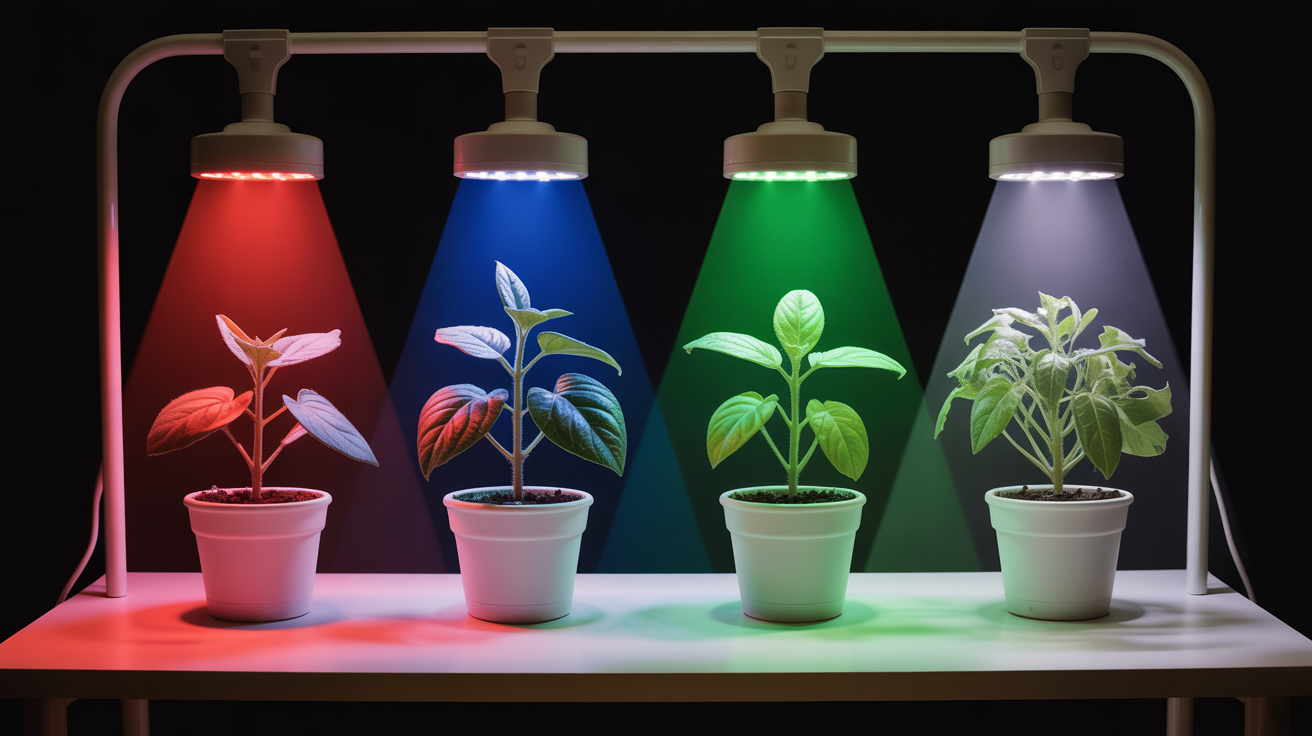
Science Fair Projects
biologymedium middle 14 days

Mapping Local Biodiversity with Quadrat Sampling

This project involves using quadrat sampling to measure biodiversity in a local ecosystem. By placing a square frame in a designated area, students will count the different species present and analyze the results to understand local biodiversity levels.

Mapping Local Biodiversity with Quadrat Sampling

Hypothesis

Areas with more vegetation will show higher species diversity compared to barren areas.

Materials Needed

quadrats5Buy
clipboard1Buy
measuring tape1Buy
field guide for plants and animals1Buy
notebook1Buy

As an Amazon Associate, this site earns from qualifying purchases.

Step-by-Step Procedure

  1. 1

    Choose a local area to study.

  2. 2

    Select five different locations within the area.

  3. 3

    Mark a quadrat (1m x 1m) on the ground at each location.

  4. 4

    Count and record all plant and animal species within each quadrat.

  5. 5

    Repeat the process for each location.

  6. 6

    Analyze the data collected for species diversity.

  7. 7

    Create a chart to display the diversity of species.

  8. 8

    Draw conclusions based on the data.

Expected Results

An increase in vegetation correlates with higher species diversity, confirming the hypothesis.

Variables

Independent Variable

type of environment (vegetated vs barren)

Dependent Variable

number of species counted

Controlled Variables

size of quadrat, location of quadrats, time of day

Safety Notes

Be cautious of local wildlife and plants that may cause allergic reactions. Wear gloves if necessary.

Presentation Tips

  • Use visuals like charts and graphs to present data.

  • Include photos from the sampling process.

  • Discuss the importance of biodiversity.

  • Engage the audience with questions about local ecosystems.

Frequently Asked Questions

Like this project? Get more ideas!