Analyzing the Role of Vegetation in Urban Heat Islands
This project investigates how vegetation influences temperature in urban heat islands. By comparing areas with varying plant cover, students can assess the cooling effects of vegetation.
This project involves creating a simple weather station to measure temperature, rainfall, and wind speed. You'll learn about meteorology and weather patterns as you collect and analyze your data. A fun project for middle school science fairs!

If I measure weather data over a week, then I will observe patterns in temperature, rainfall, and wind speed.
As an Amazon Associate, this site earns from qualifying purchases.
Assemble the rain gauge using the plastic container.
Install the thermometer in a shaded area.
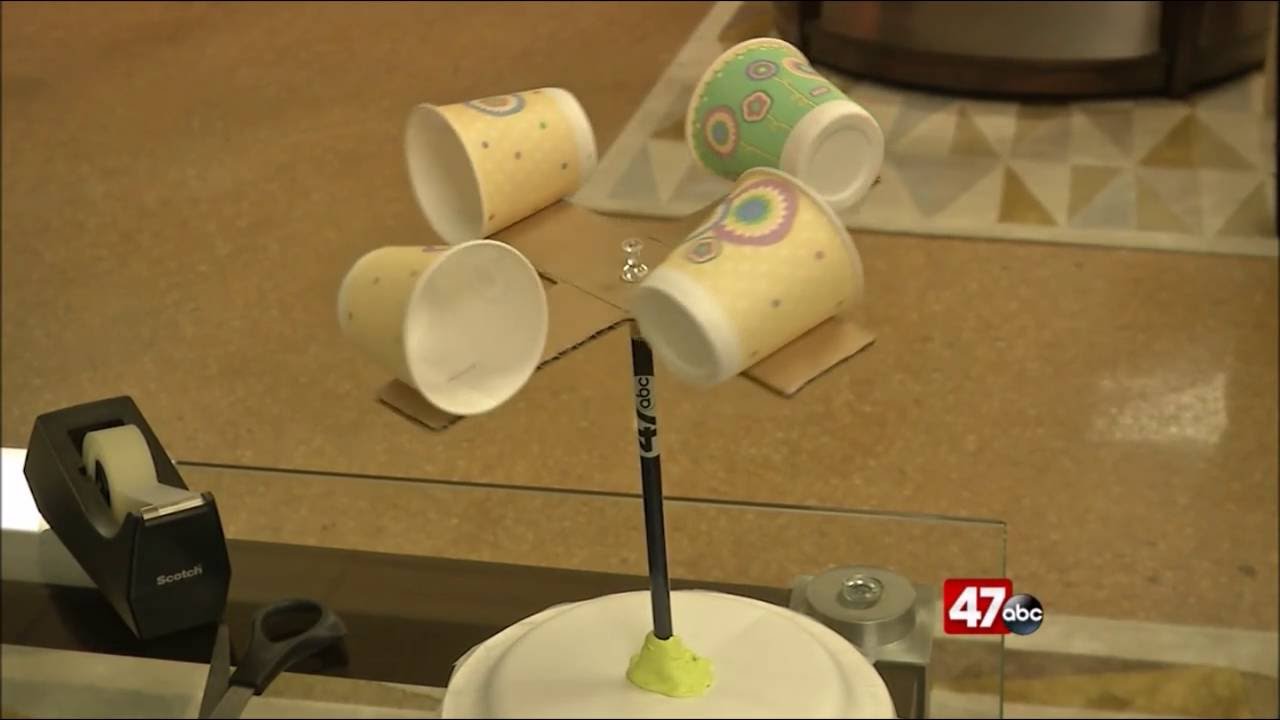
Build or set up the anemometer in an open space.
Record temperature, rainfall, and wind speed daily.
Collect data for at least one week.
Analyze the data for trends and patterns.
Create graphs to visualize the collected data.
Prepare a report summarizing your findings.
Over the week, you should see patterns in the weather data, including changes in temperature, rainfall amounts, and variations in wind speed.
Days of data collection
Temperature, rainfall, and wind speed recorded
Location of instruments, Measurement intervals, Weather conditions
Ensure safety when handling tools for mounting and avoid placing equipment near hazards.
Display graphs showing daily weather trends.
Include photographs of your weather station setup.
Explain the significance of each weather measurement clearly.
Be prepared for questions about data accuracy.
While they may not be as precise as commercial ones, they can provide valuable data.
A clear plastic container works best for easy measurement.
Daily measurement provides a clearer understanding of changes in weather patterns.