Analyzing the Role of Vegetation in Urban Heat Islands
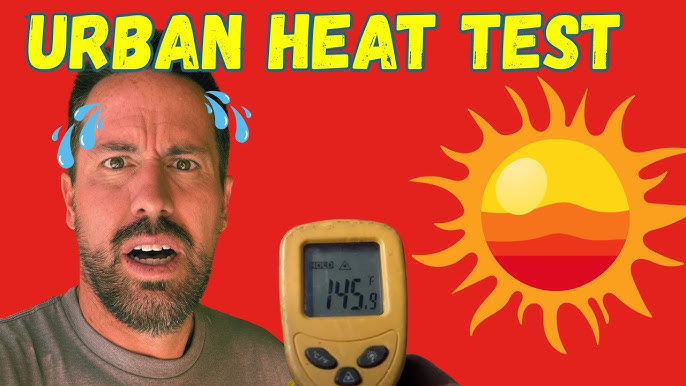
This project investigates how vegetation influences temperature in urban heat islands. By comparing areas with varying plant cover, students can assess the cooling effects of vegetation.
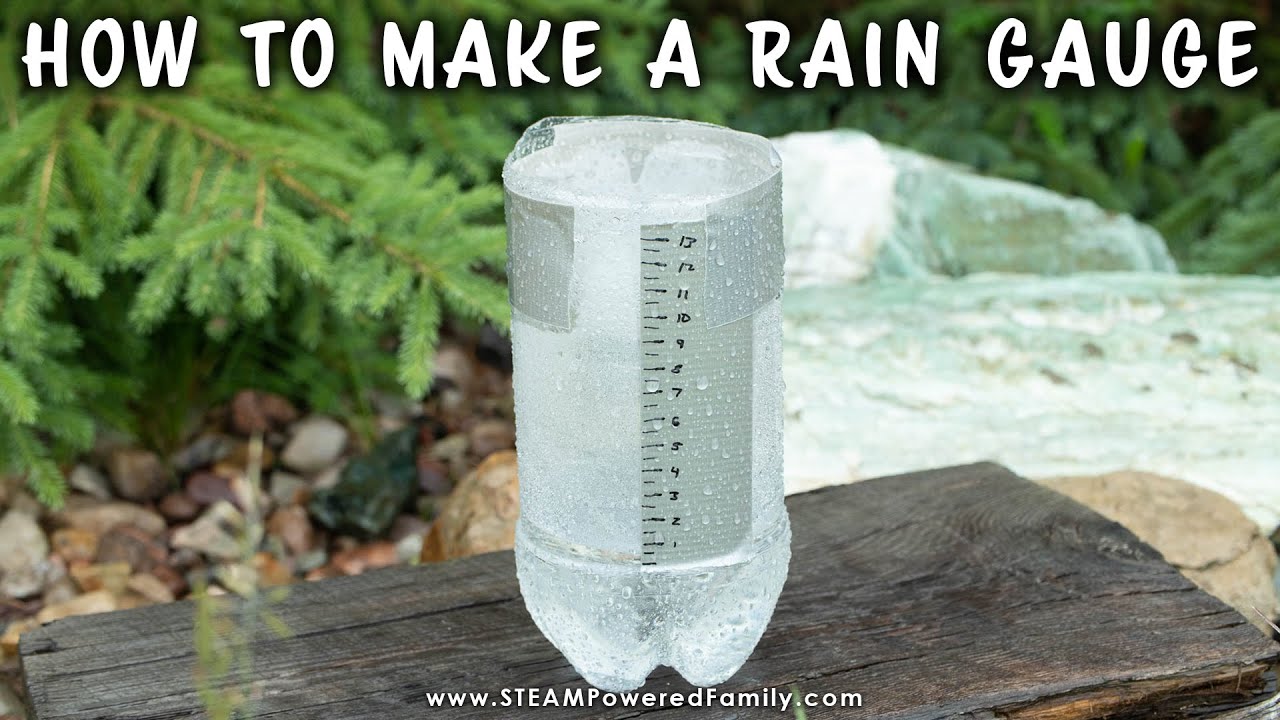
This simple project involves building a rain gauge to measure precipitation in your area. You'll learn about weather patterns and the importance of accurate measurements. A great project for elementary science fairs!

If I create a rain gauge, then I will be able to accurately measure the amount of rainfall over a specified period.
As an Amazon Associate, this site earns from qualifying purchases.
Cut the top off the plastic bottle to create a funnel.
Inverted the top part into the bottom half to catch rain.
Secure the rain gauge in an open area away from obstructions.
Use the ruler to mark measurements on the side of the bottle.
Record rainfall measurements daily.
Analyze the data to observe rainfall patterns.
Create a graph showing total rainfall over time.
Prepare a presentation summarizing your findings.
You should successfully measure and track rainfall amounts over time, visualizing the data through graphs.
Time period of measurements
Amount of rainfall measured
Location of the rain gauge, Measurement intervals, Weather conditions
Ensure safe handling of scissors when cutting the bottle and secure the rain gauge to prevent it from blowing away.
Display graphs showing rainfall trends.
Include photos of your rain gauge in action.
Explain how rainfall measurements impact water resources.
Engage your audience with questions about their rainfall experiences.
A clear plastic bottle works well for visibility.
Daily measurements provide the best data.
Yes, but building your own is a great learning experience!