Science Fair Projects
physicshard high 14 days

Determining Planck's Constant Using LEDs

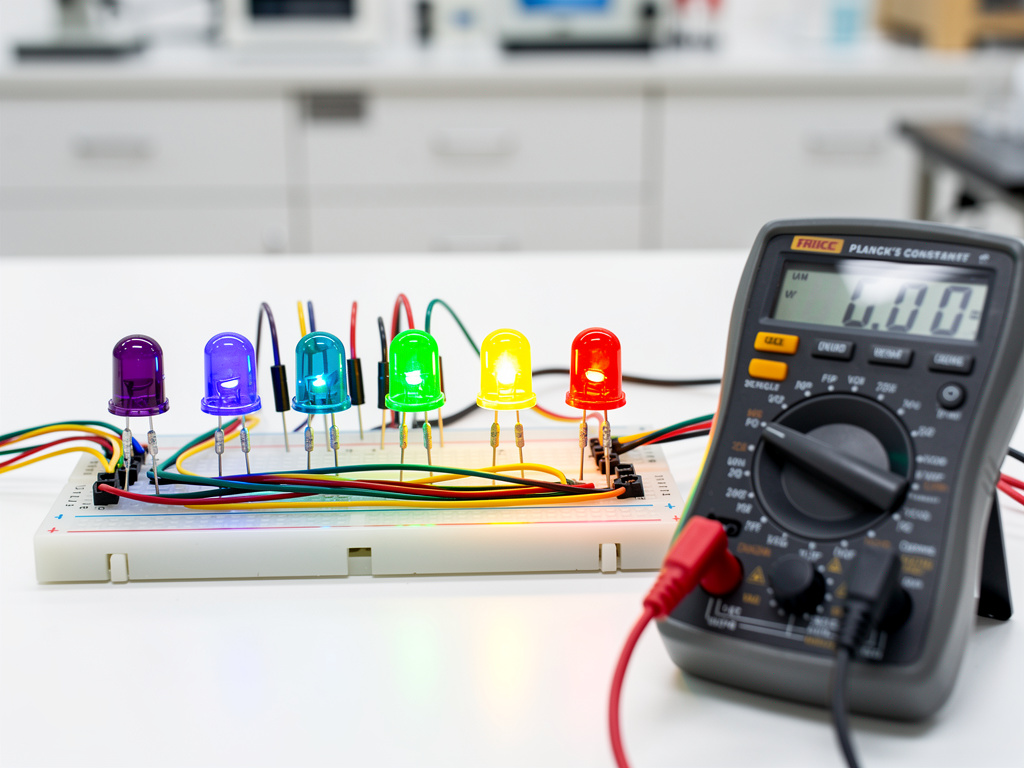
This advanced project involves calculating Planck's constant by measuring the threshold voltage of LEDs of different colors and analyzing the data.

Determining Planck's Constant Using LEDs

Hypothesis

If the wavelength of light emitted by LEDs changes, then the threshold voltage will change, allowing calculation of Planck's constant.

Materials Needed

LEDs in different colors — 5Buy
Digital multimeter — 1Buy
Variable power supply — 1Buy
Resistors — 5Buy
Breadboard — 1Buy
Connecting wires — sufficientBuy
Notebook — 1Buy

As an Amazon Associate, this site earns from qualifying purchases.

Step-by-Step Procedure

  1. 1

    Set up the circuit on a breadboard with an LED and a resistor.

  2. 2

    Connect the digital multimeter in parallel to measure voltage.

  3. 3

    Gradually increase the power supply voltage until the LED just begins to emit light.

  4. 4

    Record the threshold voltage for each LED color.

  5. 5

    Calculate the frequency of light for each LED using its color/wavelength.

  6. 6

    Plot a graph of frequency versus threshold voltage.

  7. 7

    Determine the slope of the line, which is related to Planck's constant.

  8. 8

    Analyze the data and calculate Planck's constant from the slope.

Expected Results

The slope of the frequency versus voltage graph should be consistent with Planck's constant, validating the experimental method.

Variables

Independent Variable

Wavelength/color of the LED

Dependent Variable

Threshold voltage

Controlled Variables

Ambient temperature, LED material, Measurement equipment

Safety Notes

Ensure all electrical connections are secure to prevent short circuits.

Presentation Tips

  • Explain the relationship between light frequency, energy, and Planck's constant.

  • Use graphs to clearly present your findings.

  • Discuss potential sources of error and improvements.

Frequently Asked Questions

What is Planck's constant?

Planck's constant is a fundamental constant that relates the energy of a photon to its frequency.

Why use LEDs?

LEDs provide a simple way to measure the relationship between voltage and light frequency.

How do I identify the threshold voltage?

The threshold voltage is the minimum voltage at which the LED begins to emit visible light.

Related Projects

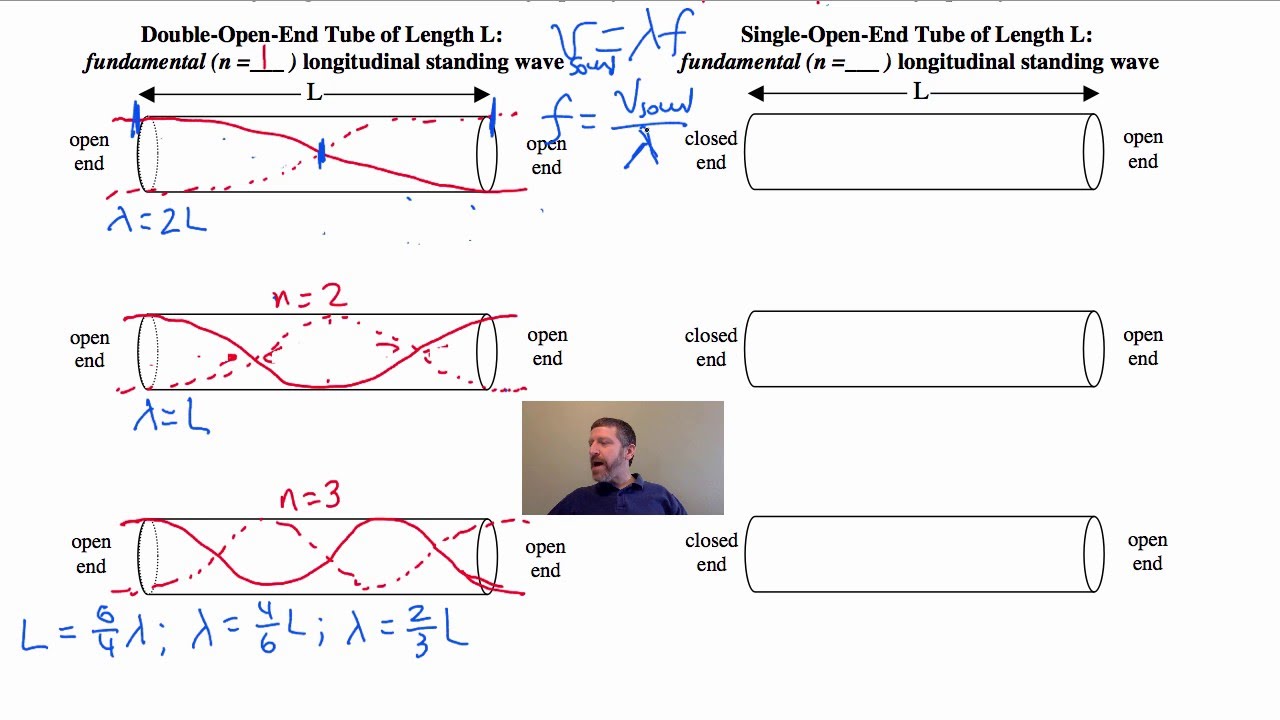
Acoustic Resonance Experiment: Standing Waves in Tubes Science Fair Project
physicsmedium

Acoustic Resonance Experiment: Standing Waves in Tubes Science Fair Project

This experiment allows you to explore sound waves and resonance using tubes. By creating standing waves, you'll visualize how sound behaves in different environments. Perfect for middle school science fairs!

7 days·middle
Analyzing Quantum Tunneling in Semiconductor Devices
physicshard

Analyzing Quantum Tunneling in Semiconductor Devices

This project investigates quantum tunneling phenomena within semiconductor devices. Students will measure how electrons traverse energy barriers and analyze how this impacts device efficiency.

25 days·high
Archimedes' Principle: Testing Buoyancy with Different Objects
physicsmedium

Archimedes' Principle: Testing Buoyancy with Different Objects

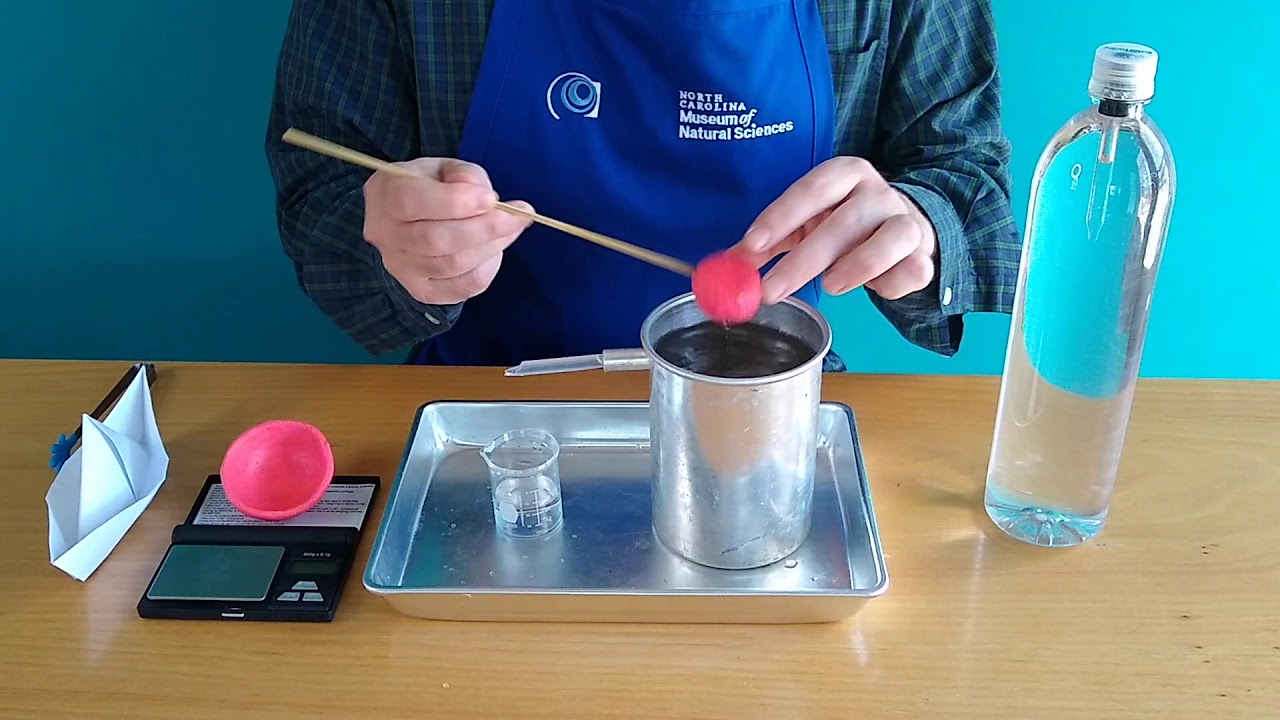
This project allows students to test various objects for buoyancy, demonstrating Archimedes' principle. It engages students in hands-on learning about density and displacement.

7 days·middle
Astronomical Observation - Tracking Planetary Motion
physicsmedium

Astronomical Observation - Tracking Planetary Motion

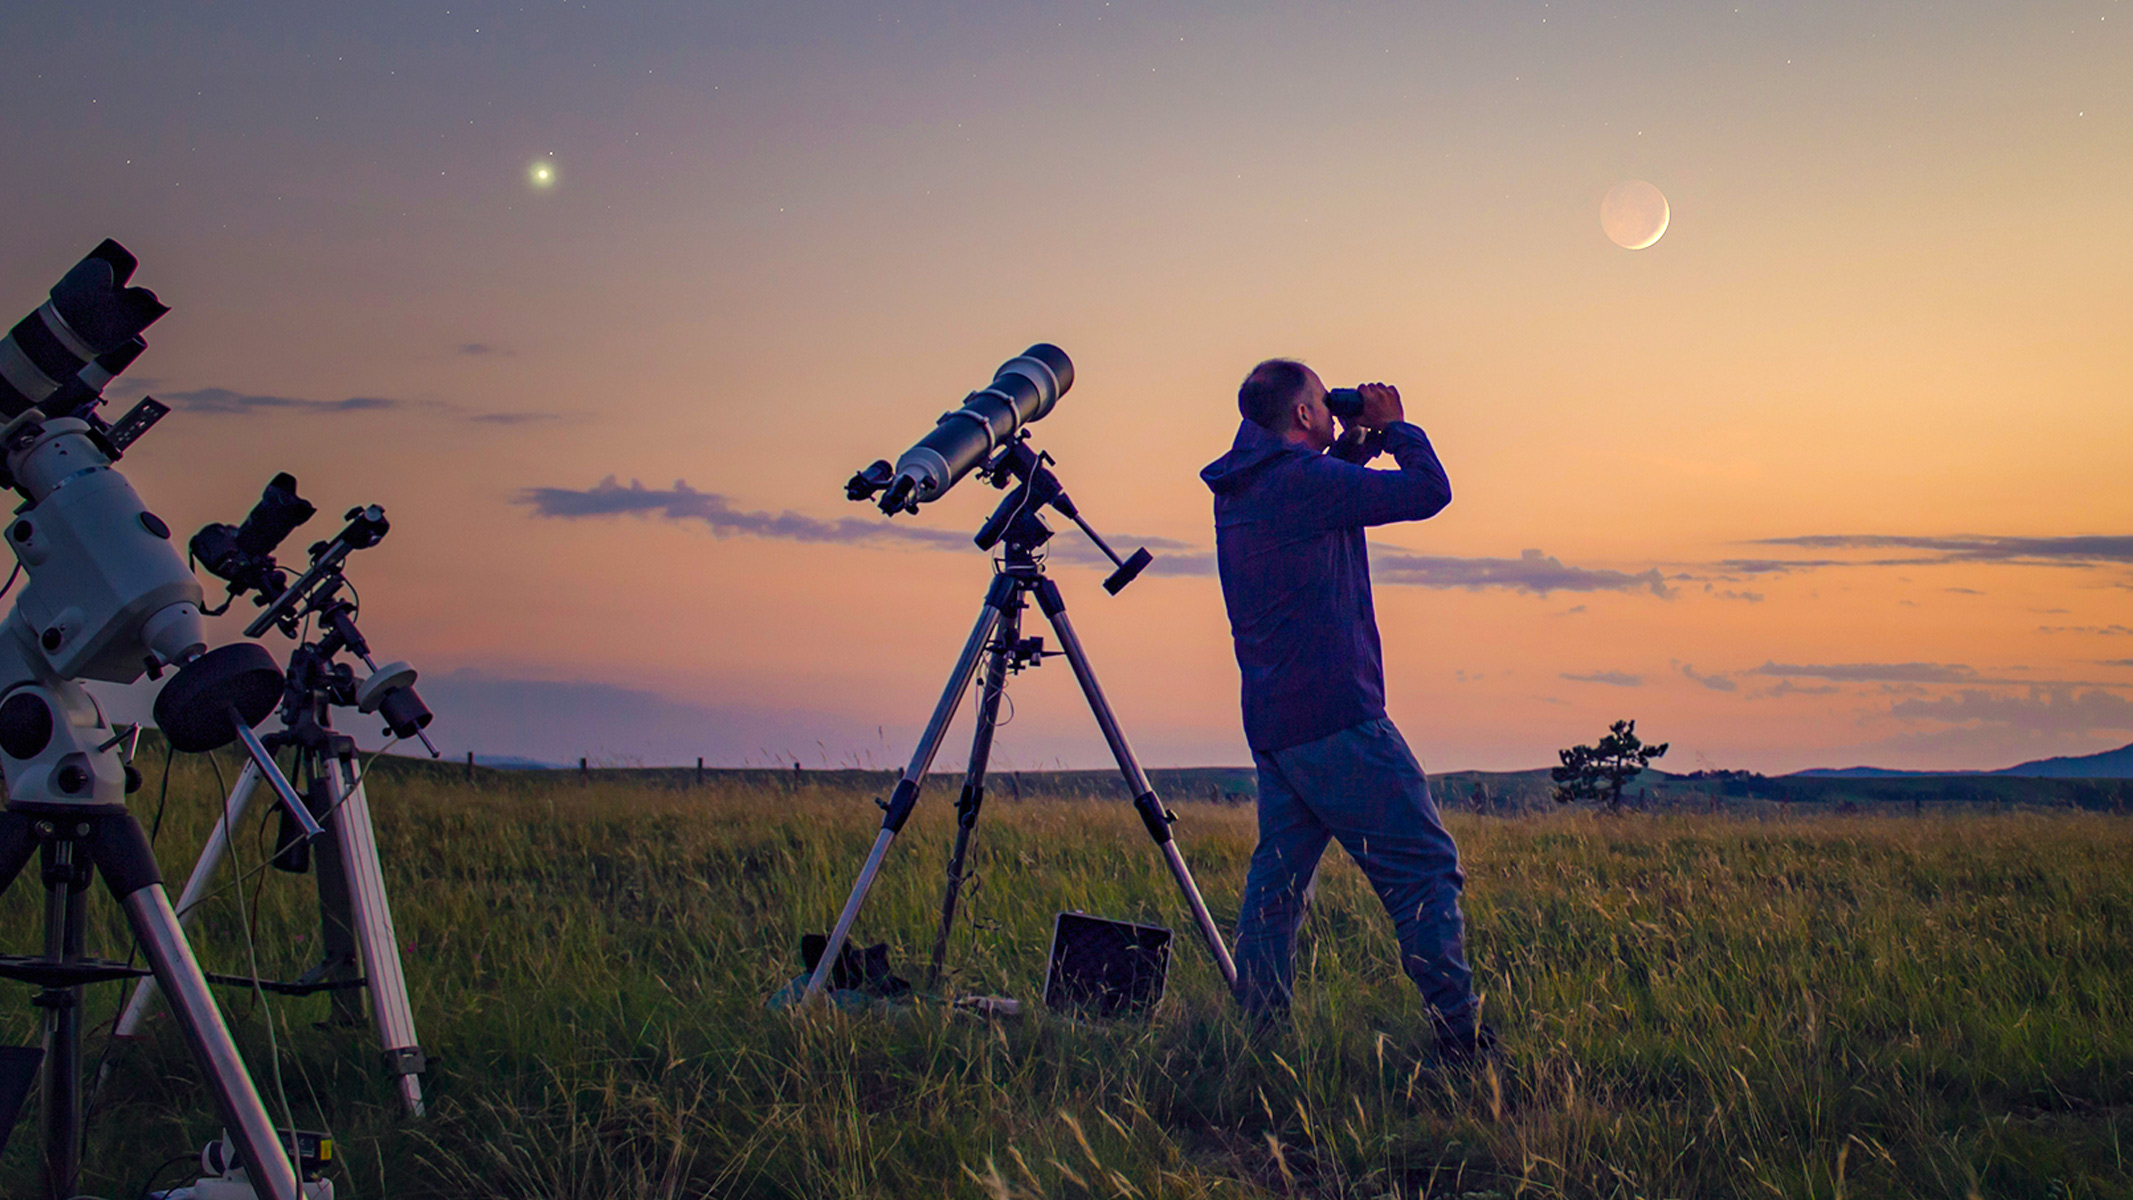
In this project, you will observe and record the positions of planets in the night sky over a month. By using a telescope or binoculars, you will track their movements, document their position on specific dates, and analyze their orbits to understand celestial mechanics. This project fosters an appreciation of astronomy and the dynamics of our solar system.

14 days·high
Atmospheric Pressure and Weather Patterns Analysis
physicsmedium

Atmospheric Pressure and Weather Patterns Analysis

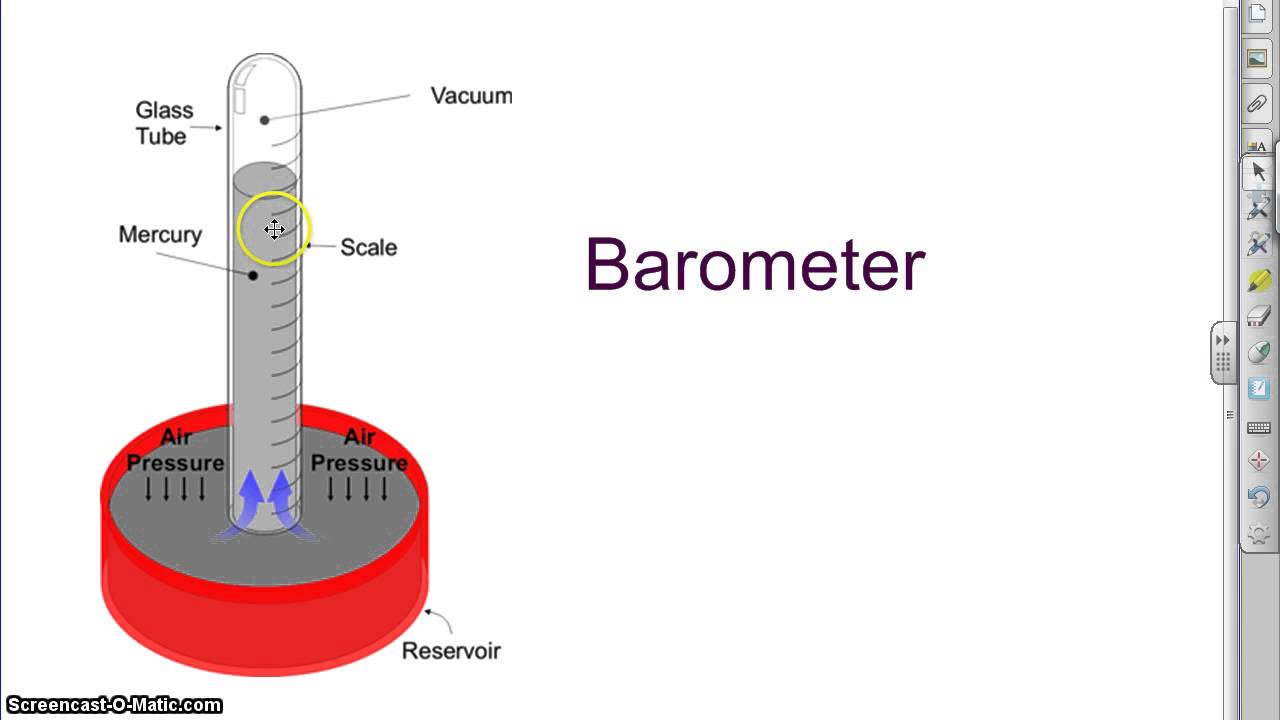
This project investigates how changes in atmospheric pressure correlate with weather conditions. By using a barometer to measure pressure and recording local weather patterns over a week, you will analyze the data to determine relationships and predict weather changes. This project emphasizes the importance of atmospheric science in understanding our climate.

7 days·middle
Balancing Act: Finding the Center of Gravity of Irregular Shapes
physicseasy

Balancing Act: Finding the Center of Gravity of Irregular Shapes

Discover how to find the center of gravity by balancing cardboard cutouts of irregular shapes on a pencil point. This project explores how different shapes distribute weight and balance.

2 days·elementary

Like this project? Get more ideas!